Alphapred
AlphaPred: A Machine Learning Tool to Aid Alpha Thalassemia Screening
Introduction
Thalasssemias occur because of mutations in the globin gene, which encodes the globin protein. Globin is part of hemoglobin, and a lack of globin production due to these mutations can cause reduced hemoglobin production, which in turn will impair oxygen supply to vital organs.
Alpha thalassemia is a constellation of four clinical conditions; two carrier states and two disease states, with different manifestations : Silent carrier state results from a single alpha globin mutation, and is either completely normal or causes mild anemia ; alpha thalassemia trait usually occurs due to two mutated genes, and cause mild to moderate anemia and minimal clinical symptoms; hemoglobin H disease is a result of only one functional gene, and causes severe anemia and clinical symptoms; hydrops fetalis occurs when all four genes are dysfunctional, and causes still birth.
Silent carriers and alpha traits are known as ‘carriers’; they are asymptomatic or have mild symptoms but can pass the mutated gene to the next generation. Reproduction of two carriers thus can give birth to a ‘thalassemia major’ patient, who may either suffer disabling symptoms of hemoglobin H disease or be still born. Therefore, carrier detection lies at the heart of alpha thalassemia prevention.
A definitive diagnosis of Thalassemia carrier state usually starts with an initial analysis of red cell indices (usually via a full blood count (FBC)). Mean corpuscular volume (MCV) and mean corpuscular hemoglobin (MCH) levels below 80fL and 27pg respectively are considered cut-off levels to diagnose a person as a ‘non-carrier’. Those who have low MCV and MCH levels (below the cut-off) are then assessed for other causes of microcytic (low MCV) hypochromic (low MCH) anemia and are usually given a trial of oral iron therapy for three months, because iron deficiency is the commonest cause of such anemia. If low red cell indices persist even after iron therapy, Hemoglobin electrophoresis via High performance liquid chromatography (HPLC) or Capillary electrophoresis is done to exclude beta-thalassemia carrier state, in which the HbA2 levels are unusually high. (a value of more than 3.5% is usually considered as evidence to diagnose beta-thalassemia carrier state). If HPLC results are normal with a normal level of HbA2, then the individual requires genetic testing to exclude an Alpha Thalassemia carrier state.
90% of countries in the thalassemia belt fall under low- or middle-income categories, making prevention of the disease a challenging task. For the same reasons, data on Thalassemia are not complete. But from reasonable estimations, every year, there are about 68,000 new births suffering from a major thalassemia disorder, including the alpha thalassemia condition known as Hydrops Fetalis, which causes still births. Barring Greece, Italy and Cyprus, numbers in most endemic countries are not showing signs of improvement.
The 118th Executive board meeting of WHO in 2006(36) highlighted this issue and urged the governments to design, develop and implement comprehensive and integrated national programmed for counter the disease, and an effective screening program me was one vital recommendation of the board.
Alpha thalassemia carrier states require expensive genetic testing to diagnose, which is a major issue in scaling up carrier screening in low-income countries. Data driven solutions offer a unique opportunity to this: available individual level data on alpha thalassemia carriers who are already diagnosed via genetic testing, can be used to train models which can detect complex patterns by comparing input data from investigations to the output which is the diagnosis. These models can then operate as intelligent entities which will take new inputs from new individuals, and make accurate diagnoses based on the patterns they already learnt. Artificial Intelligence, specifically Machine Learning, hence, provide a great opportunity in designing these innovative solutions.
While discriminating functions and machine learning approaches in classifying thalassemia and non-thalassemia individuals, alpha thalassemia carriers and normal individuals, and classifying thalassemia minor (carrier) status against other categories have been studied in several studies, no other study in published study has experimented with differentiating between the two alpha thalassemia carrier types-alpha thalassemia traits and silent carriers. This is also the first study attempting to develop a machine learning-based approach for thalassemia diagnosis in Sri Lanka.
This study attempted to build a cost-effective and data driven tool to aid alpha-thalassemia carrier detection in resource-constrained settings. It consisted of two machine learning models, which were incorporated into a web-based application, Alpha-pred.
Materials and Methods
Materials
The dataset, anonymized and in electronic format (.xlsx file format), was obtained from Human Genetics Unit, Faculty of Medicine, University of Colombo, and the ethical approval for the study was obtained from Postgraduate institute of Medicine, University of Colombo.
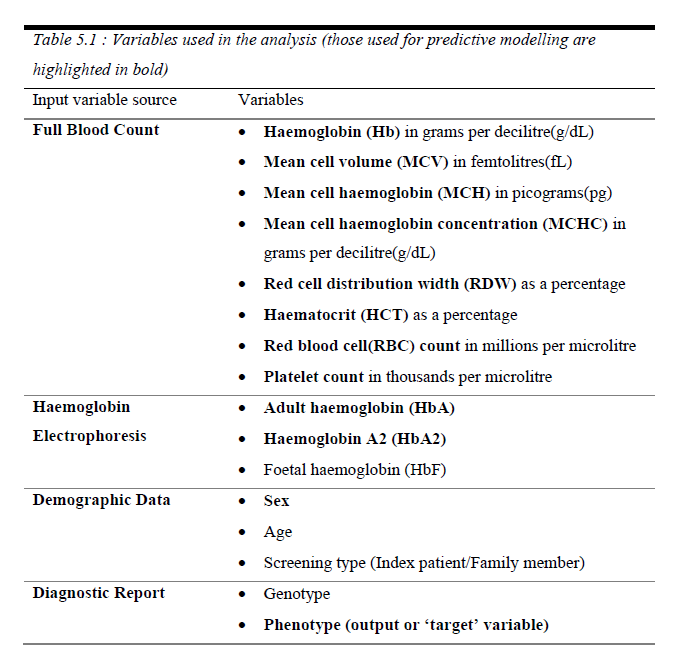 Data belonged to 288 individuals, including Full blood count data (via analysis of a venous blood sample), Hemoglobin variant data via High Performance Liquid Chromatography (HPLC) and alpha thalassemia carrier status obtained via a genetic diagnosis based on the presence of mutations. (Table 01)
Six diagnostic categories (‘phenotype’) were present, based on HPLC results for beta thalassemia traits (carriers) and major individuals, and genetic diagnosis for alpha thalassemia status (alpha thalassemia traits, silent carriers and hemoglobin H disease); ‘normal’ individuals had no full blood count abnormalities and had a negative genetic test. The accuracy of data was verified by a consultant hematologist.
White blood cell parameters were excluded from the analysis since there’s no evidence of their importance in identifying alpha thalassemia carriers.
Python programming language, and python-based libraries; pandas, NumPy, scikit-learn and fastai were used for the modelling process. R programming language and R-based library, tidyverse were used to perform paired t-tests for comparison of means.
Methods
Two machine learning models were developed, which acted as parts of a diagnostic pipeline: first model differentiated between normal individuals and alpha-thalassemia careers; output of this was fed to a second model which then classified the carriers into alpha thalassemia traits and silent carriers. Therefore, input data going through this pipeline would have one of three following outcomes (predictions): normal, alpha thalassemia trait, thalassemia silent careers. Depending on the results of the models, they were then proposed to be incorporated into a web-based tool, Alpha-pred. (Figure 01) The models were built according to the following three steps with sometimes switching between steps in an iterative software development fashion.
2.1 Exploratory Data Analysis
For both model 1 and 2, means of the two groups for each input variable were calculated, and compared using paired t-tests, after the Shapiro-Wilks test confirm the normality of distribution of all groups. This provided corroborative evidence on significant input variables to the models.
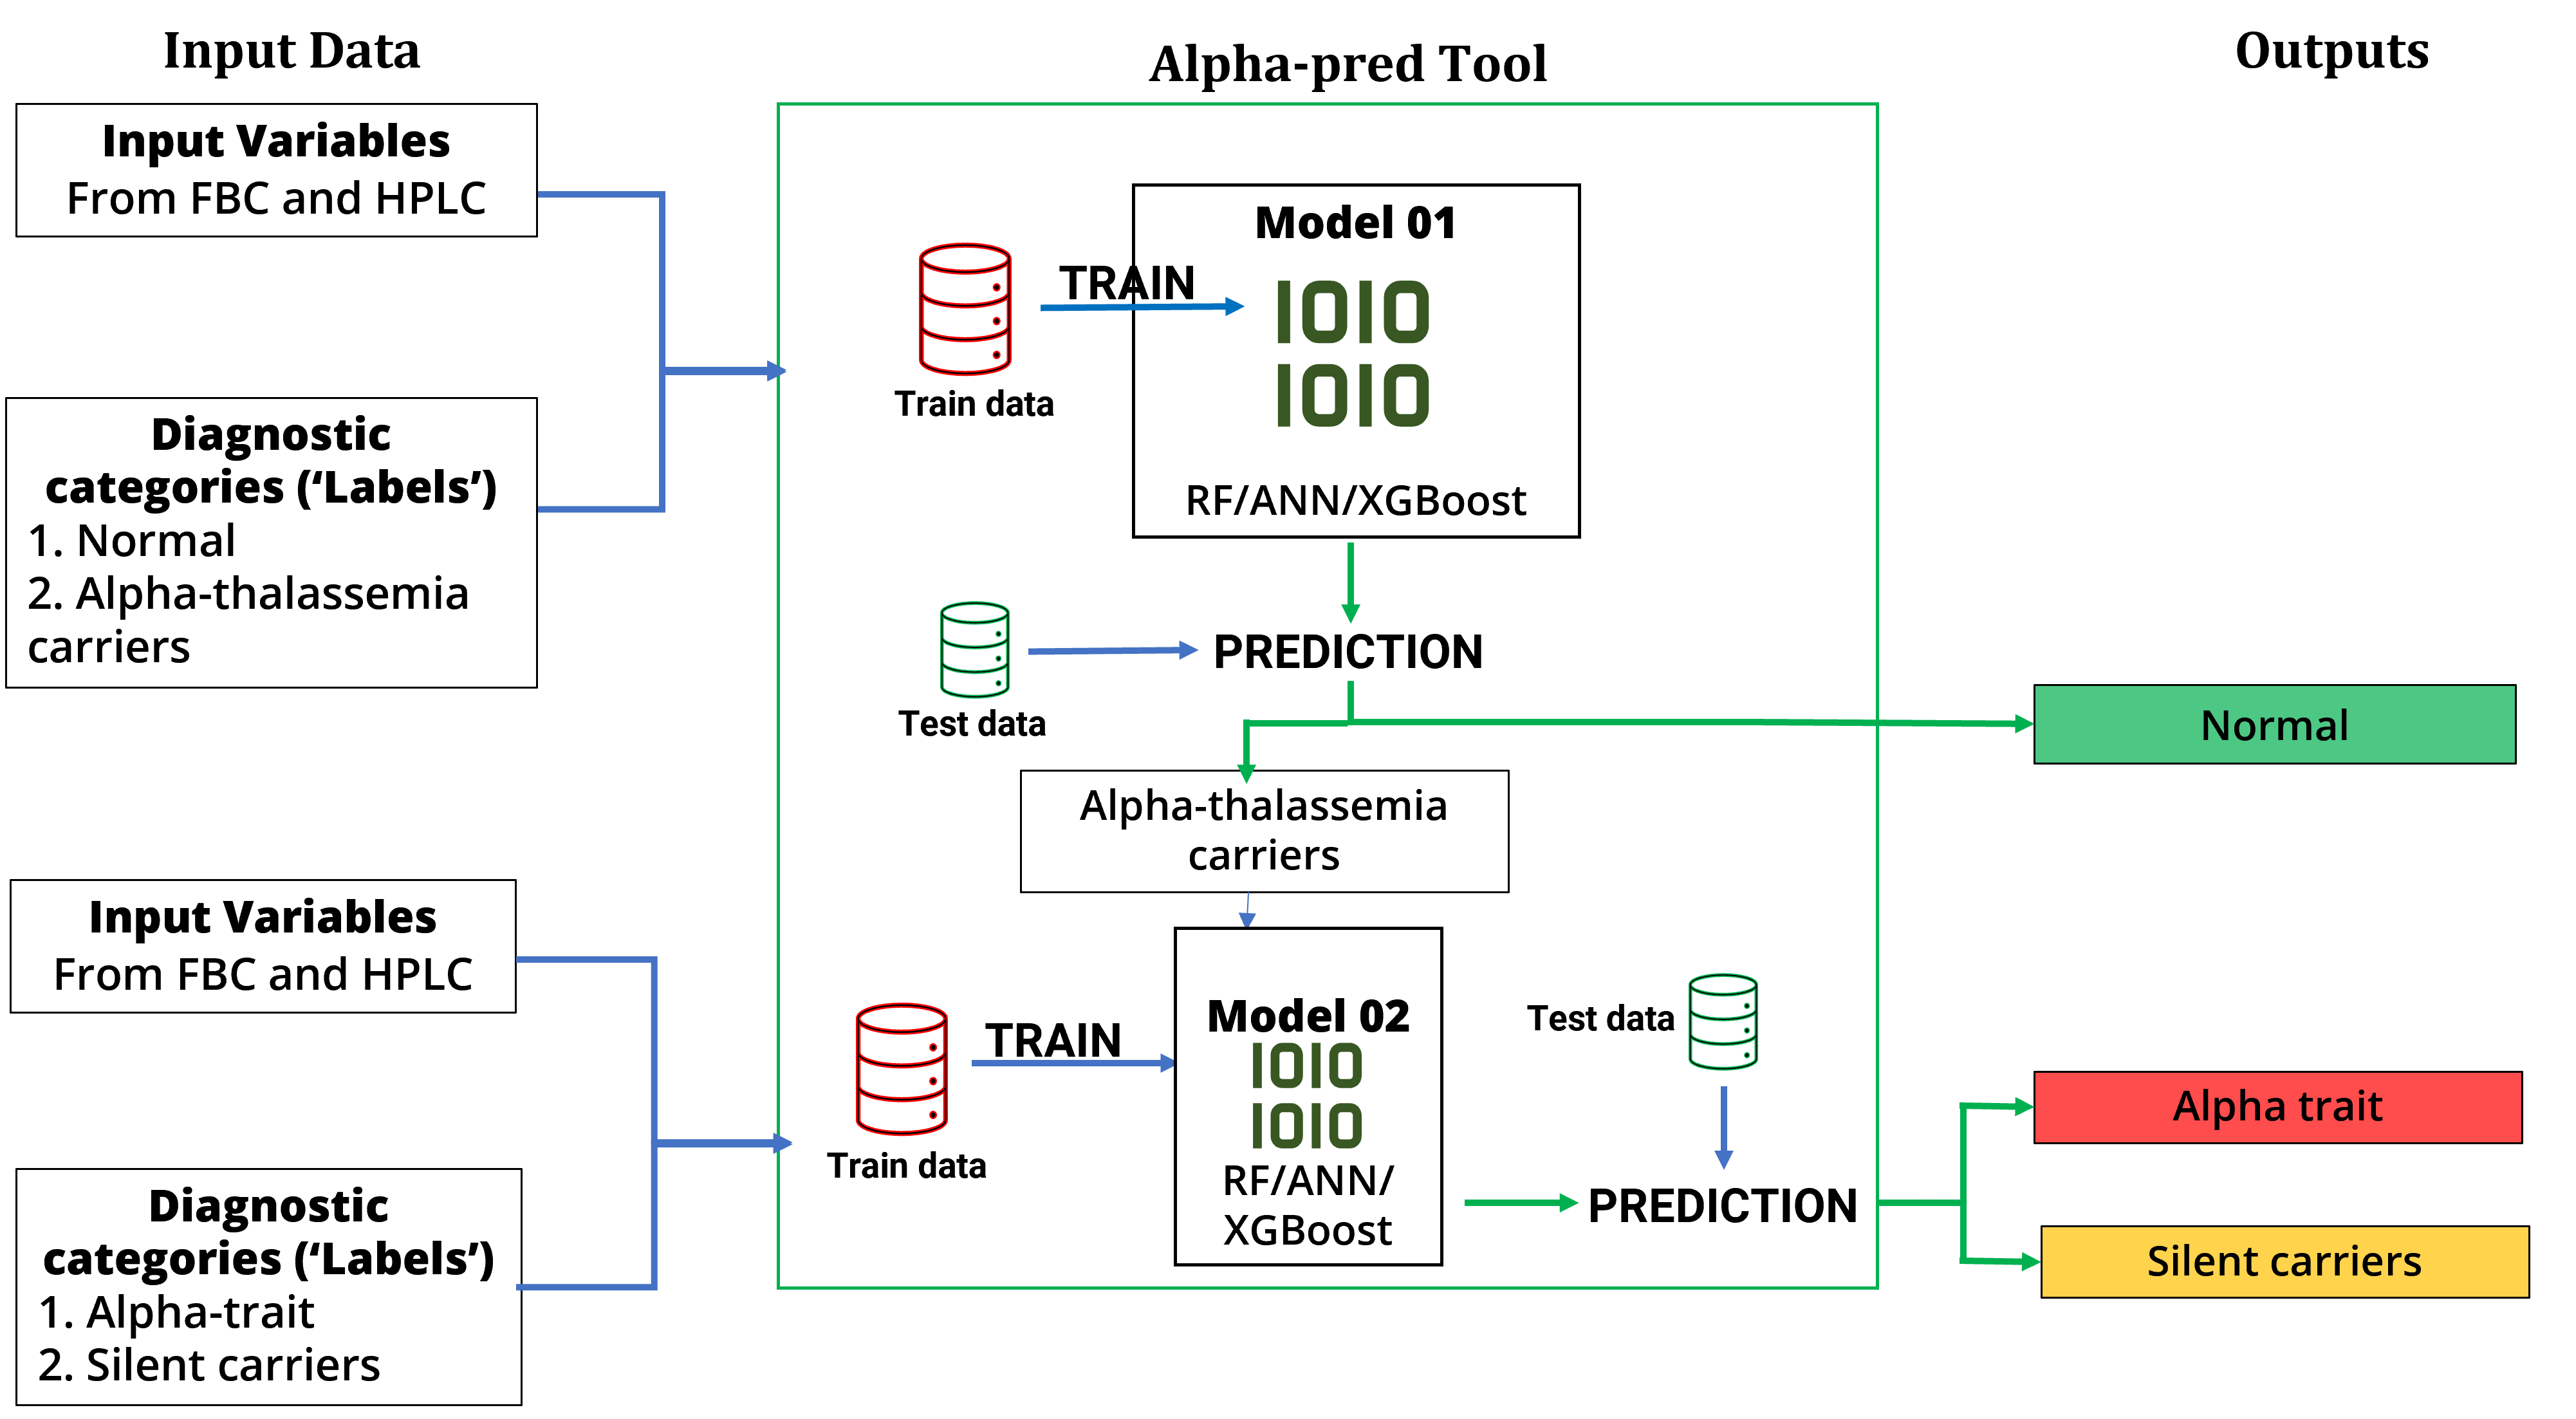
Figure 01 – Structure and functionality of the proposed diagnostic pipeline, Alpha-pred.
2.2 Data pre-processing
As data from only three categories (alpha thalassemia trait, silent carriers and normal) were needed, data elements with other diagnoses were removed from the dataset used for analysis.
Serum ferritin and age was not used in the modelling since they had more than 50% missing data. HbF had to be excluded because it varied with age, and age cannot be included to account to its variability.
Missing values of other variables were filled using the average value of the variable in the outcome category of the particular case (single imputation strategy).
Then the cleaned dataset was split into a train and test set: 20% of data was reserved as testing data. A test set is important in machine learning because a model’s performance can only be reliably tested using data that model has not seen during training.
To tackle the problem of class imbalance, normal group in model 1 was oversampled 1:1 so that both categories had same number of instances. SMOTE oversampling technique was used via the python library imbalanced-learn.
2.3 Model training
Each model initially had three different versions with three machine learning algorithms: a random forest, a gradient boosting machine algorithm (XGBoost library) and an artificial neural network four hidden layers; these were selected for this study based on the superiority of XGBoost and random forests in analyzing tabular data and its interpretability; and the recent advancements in computational power allowing neural networks to perform better with tabular data. The relative performances were compared to select the best performing algorithm.
The nature of the data set allowed the authors to take a supervised machine learning approach. In supervised machine learning, an algorithm is fed both with predictor variables and ground truths(‘labels’). Here, the predictor variables were hematological parameters from full blood count and HPLC, and the labels were the diagnostic categories. Algorithm then trains on the train set, learning patterns in predictor variables that help it to predict the correct category.
2.4 Evaluation
Three metrics were used to evaluate the performance of the models:
-
General classification accuracy (range 0-1, presented as a percentage)
-
Recall for the positive class (Sensitivity in identifying alpha thalassemia carriers in model 1, and alpha trait in model 2) – since the aim of the Alphapred tool is to identify alpha thalassemia carriers. (range 0-1, presented as a percentage)
-
Area Under Curve (AUC) of the Receiver Operating Characteristic curve (ROC) (range 0-1, presented as a percentage) –The ROC curve is a graph with:
-
The x-axis showing 1 – specificity (= false positive fraction = FP/(FP+TN))
-
The y-axis showing sensitivity (= true positive fraction = TP/(TP+FN))
It gives an overall idea of the diagnostic accuracy of a binary classifier – with 0.5 indicating a random classification.
Results
The final dataset used for analysis consisted of data from 203 individuals. Age distribution varied widely: ranging from 4 months to 77 years. Male proportion was slightly above 50%, and among the diagnostic categories, alpha thalassemia carriers made up nearly 80% of the data (N = 148), while normal individuals made up just over one-fifth of the dataset (N = 55). (Figure 02)
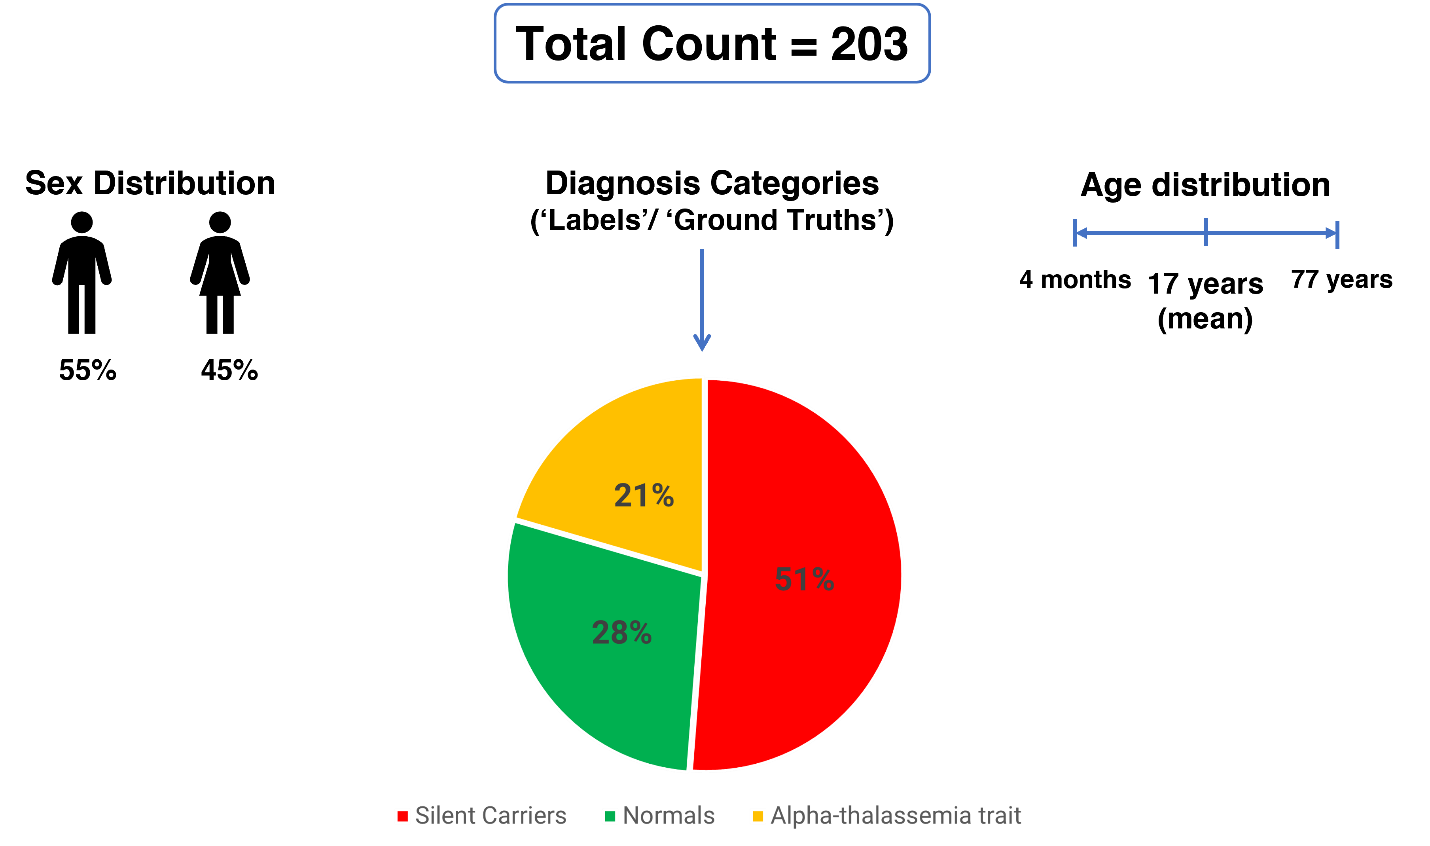
Figure 02 – Demographic characteristics and diagnostic categories of the dataset used for analysis.
Results of Model 01
We designed model 01 to differentiate between Alpha thalassemia carriers (both Alpha thalassemia traits and silent carriers as one group), and normals.
Before modelling, means of input variables between two groups were compared to gain insights into the important variables. Five full blood count variables gave statistically significant results: MCV, MCH, MCHC, Hb, and HCT. Other variables including hemoglobin variants were not significantly different between the two groups. (Table 02)
| Input variable | Mean in ‘normal’ individuals | Mean in Alpha carriers | Mean Difference between ‘normal’ & Alpha carriers (95% CI) |
Absolute T-value |
Statistical Significance (P-value) |
|---|---|---|---|---|---|
| MCV(fL) | 81.82 | 70.75 | 11.07(8.88-13.25) | 10.01 | P =2.2x10⁻¹⁶ |
| MCH(pg) | 27.07 | 22.85 | 4.22(3.28-5.17) | 8.86 | P = 1.22x10⁻¹⁴ |
| MCHC(g/dL) | 33.45 | 32.06 | 1.39(0.85-1.91) | 5.16 | P = 9.44x10⁻⁷ |
| Hb(g/dL) | 13.44 | 11.54 | 1.90(1.44-2.35) | 8.29 | P = 2.56x10⁻¹³ |
| HCT(%) | 33.45 | 32.06 | 1.39(0.85-1.91) | 5.16 | P = 9.45 x 10⁻⁷ |
| HbA(%) | 84.87 | 86.75 | 1.88(-0.32-4.09) | 1.71 | P = 0.09 |
| HbA2(%) | 2.67 | 2.55 | 0.12(0.23 – 0.008) | 2.12 | P = 0.04 |
Table 02 : Mean Comparison between groups in Model 1
(*Bold P values are statistically significant at 95% Confidence Interval)
Upon evaluation, all machine learning algorithms performed satisfactorily, but XGboost performed better than other two: A classification accuracy of 83%, Sensitivity of 84% and AUC of 0.8 (Table 03). The confusion matrix is plotted in Figure 03.
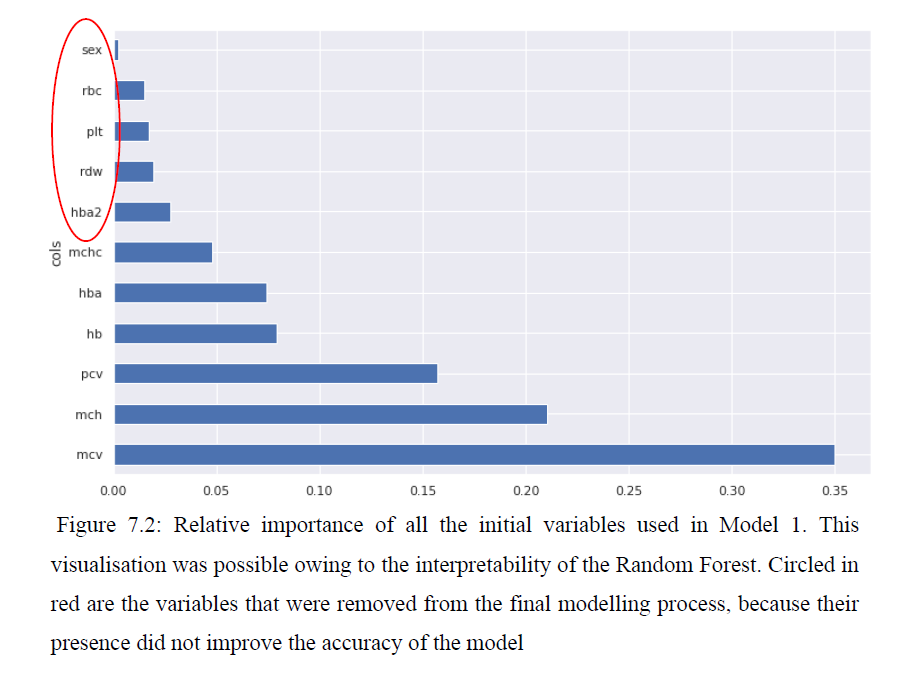
We analyzed the trained random forest, to understand the relative importance of input variables towards the model performance: Mean corpuscular volume was the most important variable, followed by Mean corpuscular hemoglobin and hematocrit. Sex, red blood cells, platelets, red cell distribution width and HbA2 were removed from the final modeling, because their presence didn’t improve evaluation metrics. (Figure 04)
Table 03 – Summary of the results obtained by two models
| Model | Input Variables (Predictors) | Output (Target) Categories | Performance of the best model on test set |
Most Important Feature (via Decision Tree visualisation) |
|---|---|---|---|---|
| Model 1 | Full Blood Count MCV, MCH, MCHC, Hb, PCV Haemoglobin Variants HbA |
|
XGBoost : Accuracy – 83% AUC – 0.8 |
MCV ≤ 80fL |
| Model 2 | Full Blood Count MCV, MCH Hb, PCV, RDW, RBC Haemoglobin Variants HbA, HbA2 |
|
XGBoost : Accuracy – 87% AUC – 0.84 |
MCH ≤ 21pg |
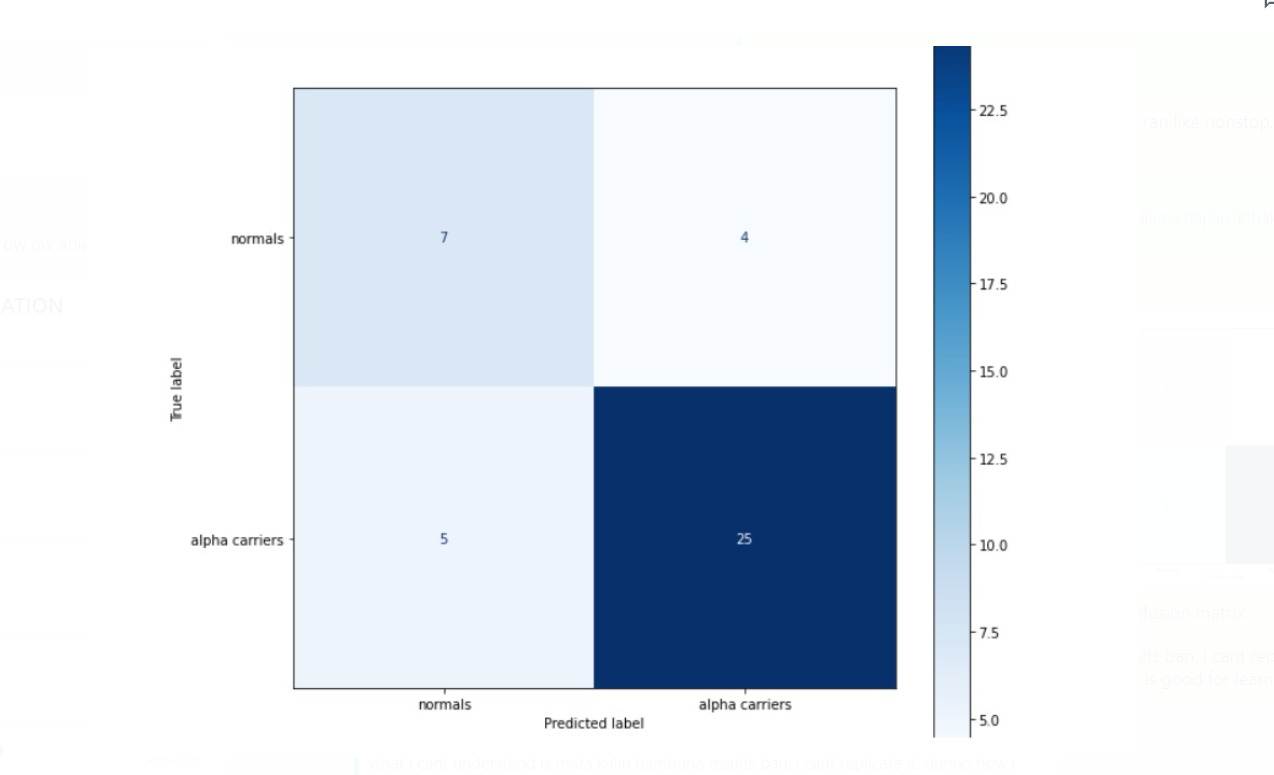
Figure 03 – Confusion matrix of model 01 (generated via python code)
Results of Model 02
Model 02 classified the alpha thalassemia carriers identified from model 01, into alpha thalassemia traits and silent carriers.
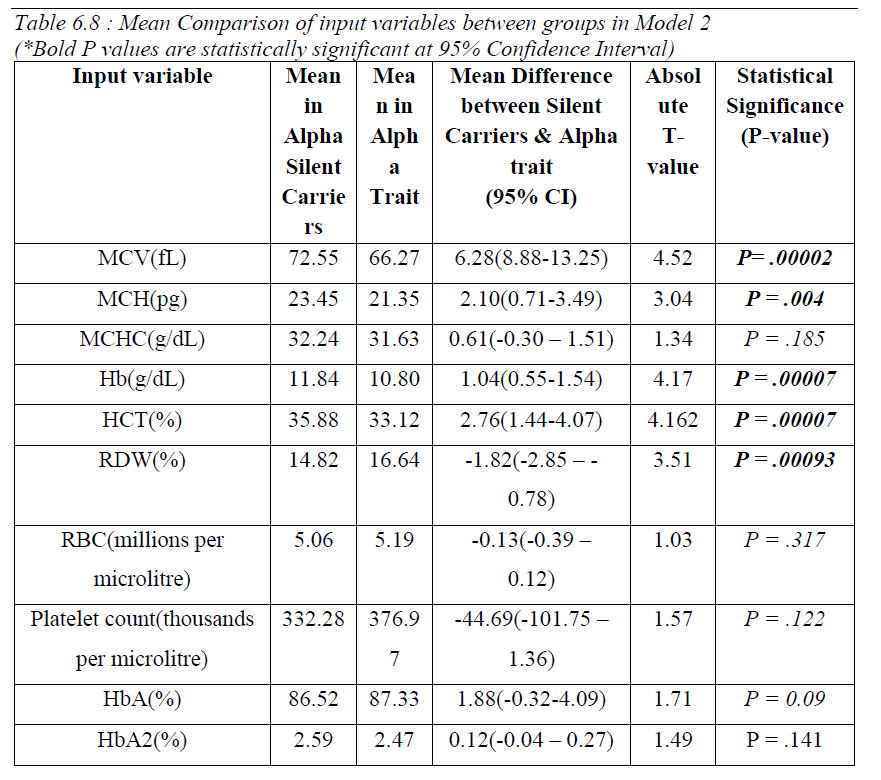
Comparison of means between the two groups revealed that values of MCV, MCH, Hb, HCT and RDW was significantly different between them. (Table 04). Hemoglobin variants were not significantly different between the two groups.
Upon evaluation, all machine learning algorithms performed satisfactorily, but XGboost performed better than other two: A classification accuracy of 87%, Sensitivity of 89% for alpha traits and AUC of 0.84 (Table 03). The confusion matrix is plotted in Figure 05.
As with model 01, we analyzed the trained random forest model for relative importance of input variables: Mean corpuscular hemoglobin was the most important variable. Sex, mean corpuscular hemoglobin concentration, and platelet count were removed from the final model because they did not improve the classification accuracy or F1 score. (Figure 06)

Figure 05 – Confusion matrix of model 02 (generated via python code)

Discussion
We found that both models gave promising results with a relatively small dataset for a machine learning problem, and XGBoost algorithm gave the best results in both models. Sensitivy of 84% in detecting alpha carriers, and sensitivities of 89% for alpha traits and 86% for silent carriers are the most important metrics given the aim of the proposed tool. AUC of ROC of 0.8 and 0.84 for the two models suggest that model performs satisfactorily in general.
The two models were incorporated into a web-based tool, Alpha-pred, as described in the methods section. The tool can be used for further study an can be accessed via https://alphaphred.herokuapp.com/
The source code is hosted at https://github.com/truthdead/AlphaPred
In 2002, Amendolia et al studied the performance of a machine learning model on a dataset of 304 adolescents in Sardinia. A neural network with one hidden layer, which classified normal, alpha thalassemia carriers and beta thalassemia carriers, was used. The model achieved only 73% sensitivity in classifying alpha thalassemia carriers; one of the reasons for the result could be that the neural network had only one hidden layer, limiting its ability to learn patterns. Also, they used mean corpuscular volume (MCV), Mean corpuscular hemoglobin (MCH), Red blood cell count (RBC) and hematocrit (HCT), while Model 01 in the current study used two additional parameters : Hemoglobin and HbA and removed RBC from the final model because its presence didn’t improve the performance. In 2003, Amendolia et al managed to achieve 85% sensitivity in detecting alpha thalassemia carriers using a different machine learning algorithm, standard vector machines.
In 2013, Guy et al concluded that MCV, RBC and RDW are the most important variables in differentiating normal individuals from thalassemia minor cases. They achieved a 95% sensitivity in doing so via an artificial neural network. However, in our study, interpretation of random forest algorithm which performed better in classifying alpha carriers and normal, showed that inclusion of RDW and RBC didn’t improve the performance; but MCV was the most important variable influencing the model performance. MCV, was also the ‘first split’ of the random forest model: the single best split that provides the least error while predicting the target outcomes(‘labels’) (Figure …) In 2021, Fu et al trained a standard vector machine to classify a dataset of 303 individuals between alpha thalassemia carriers, beta thalassemia carriers, and non-thalassemic anemia. They achieved an accuracy of 76%, which was less than the performance of the current study. All of these results suggests that bagging techniques such as random forest are more powerful than other traditional machine learning algorithms in classifying structured data.
So far in the published literature, there’s no study using a machine learning approach to differentiate between the two types of alpha thalassemia carriers. Other strengths of this study are the presence of a gold-standard genetic diagnosis as ground truths, which gives accurate labels for the models to train, and that two models are incorporated into a web-based tool, which can be used for further studies via a convenient user interface.
One of the major limitations of this study is the size of the final dataset used (N=203), which is low for a machine learning model; a larger dataset would give more data for the model to learn patterns and would improve the performance metrics. Another limitation is that the data used for modelling are historical study needs to be further validated using prospective data, although the test set used in evaluation was separated before modelling and acted as new data model has not previously seen.
Avenues for further research include validating this tool using prospective real-world data and replicating the approach using a larger dataset. This methodology could be useful to develop a model to predict beta-thalassemia carrier status, which is an important problem both in Sri Lanka and certain parts of the world.
Conclusion
This proposed machine learning tool showed promising results in our analysis and once validated with prospective data, can be used in the clinical setting. Rather than replacing the gold-standard genetic testing for alpha-thalassemia, we suggest that it can be used as a decision support tool which can rapidly screen a large number of individuals and prioritize those who need genetic testing. The developed tool can be hosted in a web server and can be used remotely using a mobile device or a personal computer, without any additional cost except the use of internet. Hence, this could be especially valuable in resource-constrained settings where genetic testing is either unavailable, time-consuming, or expensive.